
Projector 1
Utility: Graphics · ZX-Spectrum 48K · 1 players · English
McGraw-Hill Book Company UK Ltd · 1984 · Pound sterling 13.95
Discussion
Nobody has started a thread about this yet.
Play
- Projector1.tzx.zipTape image English25 KB
- Projector1.tap.zipTape image English24 KB
Documents
- Projector1.pdfInstructions English48 KB
- Projector1.zipInstructions English16 KB
Files and rights
No permission is on record either way. Screens and pictures are copied here on a take-down basis: if you hold the rights and want something removed, say so and it goes.
Credits
- R.D. Mosscredited
- Ged Fitzgibboncredited
Sign in to credit somebody, or say what these people did.
Scores
In the magazines
- Personal Computer News #871984 · Overall Value4/5
- Sinclair User #351985 · Gilbert Factor8/10
In the magazines 13
Sinclair User #35Feb 1985 · p.1228/108/10
Gilbert Factor 8/10
Mike Wright 8/10
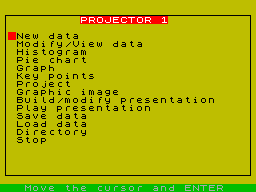
THE PROGILE OF PEAK PERFORMANCE Mike Wright examines the advantages of the McGraw-Hill small business suite. SPECTEXT Memory: 48K Price: £13.95 PROFILE 2 Memory: 48K Price: £13.95 PROJECTOR 1 Memory: 48K Price: £13.95 This month Sinclair User is offering a special deal on a package of four programs from McGraw-Hill. The package is Spectext, a word processor, Profile 2, a spreadsheet file handling program, Projector 1, a business graphics package, and Electronic Diary. The most commonly used part of any business type package is the word processor. Consequently it should be powerful while being easy to use. Usually there has to be a trade off between the two otherwise the program would use the whole of memory with no room for the text. There is no doubt about the power of Spectext. It consists of three parts: Spectext, Specfile, and Specmerge. Specfile is a simple card index database for names and addresses and Specmerge is a program which allows you to insert the names and addresses from Specfile into a standard document produced by Spectext. It also has all the usual features for entering text, deleting characters, inserting, block delete and block move, and save and load. Text can be printed with page numbers, margins and double spacing from the start or even from a specified line. The manual is stored as two text files on the other side of the tape and those need to be loaded, read and printed - if you want something handy to refer to ?- before you begin. On a ZX printer the first of those uses about eight feet of paper. The program is run from the main menu which has eight options: enter text, load text, print text, read edit text, save text, reorganise, switch printers and a microdrive catalogue. Unlike most word processors text is entered at the cursor at the bottom of the page and scrolls upward. When entering text you are given no idea of what it will look like at the end. Text is added in one continuous stream with new lines, paragraphs and pages being denoted by a graphics character. Those are inserted into the text by pressing Enter followed by 1, 2 or 3. Entering 'z' takes you back to the main menu and Enter on its own puts you straight into option four of the main menu - "edit text". If after you have been editing your text and decide to enter some more, selecting Enter text from the main menu gives you a clear screen as if no text had previously been entered. However new text will be added to the end of the old text. The Edit text option allows you a wide range of functions which will delete text in a block, add text at the cursor or print from the cursor to the end of the text. You can also search for any string and replace it with any other. Blocks of text can be moved around using the move option, although the method used is awkward since it involves deleting the text first. The move option inserts the last piece of text deleted at the cursor. Selecting Edit text displays the end of the text with a message line showing the page number and the number of characters left which can be used. Text is deleted by positioning the cursor under the first letter to be deleted and pressing D moving the cursor to the last letter and pressing D again. Text can also be added at, or printed from, the cursor by pressing 'a' or 'c'. To use the other options the 'z' key must be pressed. That gives the prompt 'type?' which allows text to be added at the cursor. Pressing Enter changes the prompt. When the required option is displayed enter 'z' again to select it. Although the text shown on the screen has words straddling lines, no obvious margins or paragraphs and graphics characters dotted throughout, it is formatted when printed. The number of characters per line, lines per page, left margin setting and the number of blank lines between pages are set in the reorganise option prior to printing. Spectext prints happily on the ZX printer but if you want to use a full size printer you will need to exercise care. The switch printer option and the documentation both lead you to believe you need to use that option for a full size printer. I tried it with my Tasman interface and it hung completely. I then tried printing without it but simply using reorganise to set an 80-column width. It worked perfectly. The database Specfile lets you set up records with up to 15 different fields, each field a maximum 23 or 25 characters. The number of fields, fieldnames up to 10 characters, and the length of each one must be set up at the start and then cannot be changed. Once the structure of the database is set the records can be entered. For each record a list of the fields is shown and you are prompted for the entry. Confirmation must be given at the end of a record that is correct. Once entered the records can be sorted on any field except the last. You can search the file for any string of characters and then once a record is on screen edit it, copy it or simply search for the next record with the string in it by entering 'z' when the option is shown. Specmerge, the third program, is easy to use. The draft letter is set up in Spectext with the variables being rep- resented by a number between two arrows, such as >3<, and saved. The numbers correspond to the field numbers in Specfile. Once Specmerge is loaded the document is read in first followed by the database and the field variables are merged. The results can be printed to the screen or printer. At £13.95, Spectext offers the most powerful word processor available as a single program for the Spectrum. However, that must be balanced by the fact that it is impossible to see what you are ultimately going to end up with typing in text. In fact it will probably take several tries at printing to the screen and re-editing before you are happy with the results. Not being able to use the program from microdrive is a major mistake for any word processor that wants to be taken seriously. However, McGraw-Hill do offer an upgrading service for purchases of the cassette, providing a microdrive version for a minimal handling charge. The idea of combining some of the best features of spreadsheets and databases into one program is clever. Profile 2 simulates a large sheet of paper divided into rows and columns. The columns are given fixed headings corresponding to fieldnames in a database, where the rows are the records. Like Specfile the fieldnames (up to four characters), their width (between four and 28 characters), type (character or numeric) and number of decimal places (up to four) must all be set at the start and cannot then be changed. That is done in a short program which is loaded before the main one. When the main program is loaded a clean sheet of paper stretches before you waiting for your entries. The field names are shown on the top line of the screen and the bottom line is used to show the first 31 characters of the row. Movement around the spreadsheet is done using the cursor keys as normal. Faster movement is achieved by moving a field at a time using the odd combination of Caps Shift with 2 (left), 3 (down), 4 (up) and 9 (right). Once your records have been entered you can begin processing using a 12 option menu. The menu is reached by pressing Caps Shift and 1 and lets you insert and delete records, which can also be protected by 'locking' them against overwriting. Numeric fields can be checked to see that they contain sensible information and can also be totalled. The totalling can also be done for a conditional selection of records. Another option is used to indicate the number of records already used and the maximum left in the database. The most powerful features of Profile 2 are held in the three options print, find and replace. The find option searches for records that are specified by a conditional statement. The conditions are similar to those used in Basic - equal, greater than, less than, AND, OR, NOT, and so on. When a record is found it is displayed on screen in the same format as used by the view option. The print option allows you to print all or some records. A conditional statement of the type 'fld1 = McGraw' is used to select the records. After you have decided which records to print you are given the opportunity to design the layout of the printed report by stringing together a series of fieldnames, text in quotes and N$ for newlines with + signs. String slicing can also be used to print part of a field. The replace command allows you to replace the data in all or some of the records with new data which is determined by specifying it as a function of the fields. For example, if you keep a price list on it and prices from a supplier increase by ten percent, then prices can be updated by supp="McG" followed by pric=pric*1.1. Strings can also be sliced and concatenated as part of the function. Profile provides a nice compromise between the spreadsheet and database and is surprisingly easy to use, despite not being very user friendly. No indication is given on screen as to how the commands can be reached and the menu lists a string of letters without a description of their function. Because of the format there has inevitably been a trade off in power but the more I used it the more I liked it. Profile 2 is compatible with microdrive storage in that the cassette is only required with designing the file. Once you have set the file format, successive generations of file and data can be stored on cartridge. The most exciting and probably the most powerful program of the three is Projector 1 - the Business Graphics system - but it is not without its problems. It gives you the facility to enter data in six different ways, either as ordinary numbers, as pairs of numbers or in a calendar format (daily, monthly, quarterly, years). Once entered the data can be displayed as a line graph, pie chart, or histogram. However its features and facilities do not end there. Graphs can be plotted as points or line graphs, with or without a background grid. More power features allow you to fit a line or curve to the data and even to obtain possible projections. A further feature allows you to build up a presentation of graphs and charts. These can be interspersed with text slides which consist of up to six lines of enlarged text with as many as 21 characters per line. Before the main program is loaded a short program lets you prepare to use one of five preset interfaces, the ZX printer or to load your own printer software. You might encounter difficulties with Tasman option. The program is run from a main menu offering the following: new data, modify/view data, histogram, pie chart, key points, project, graphic image, build/modify presentation, play presentation, save data, load data, directory and stop. The best place to start is the directory option which allows you to view what has been created and to debate some or all of the items. It also shows how much free space is left. If you have opted for one of the printer ports you could have a problem here as you are warned to leave at least 300 characters free otherwise the data will overwrite the printer software. That means regular checks on the directory when working on a presentation. Selecting view displays the items which have been created giving each a reference number made up of a letter and a number ? for instance, g3 is the third graph created and klO is the tenth key point screen - the type and its name. The references are used to build up the presentations. Histogram, pie chart and graph are used to draw the corresponding chart. In each case you are allowed to specify various formatting variables such as colours and titles. Projections of the data values along a straight line or a quadratic curve can also be done using the project option. Building a presentation consists of creating a series of slices made up of graph, chart and key point references, giving it a name and specifying whether each slide will be automatically displayed after a set time or changed manually. The number of times the demonstration will be run can also be set. After that the presentation can be run by the play presentation option after specifying the name and whether it can be stopped in mid-stream. Projector 1 has tremendous potential for business use and is relatively straightforward to use. Using STOP - Symbol shift and A - to move from entering data, or setting up the charts, to drawing them is inconvenient and if a large amount of data is used it seems slow when preparing items although there is no delay when a presentation is done. At times it also seemed sluggish in responding to entries at the keyboard when typing in titles. Those do not detract greatly from its usability. McGraw-Hill will be providing an upgrade service similar to that for Spectext when the company is confident of supplying reliable microdrive versions.
Profile 2 bar chart
Spectext letter after printing.
Spectext letter on screen.
ZX Computing #17Feb 1985 · p.28
Clive Smith
An ideal program for use in schools, business training or those dreaded sales meetings. Projector 1 enables you to build and present graphs, histograms and pie charts easily and quickly. It it is treated very much like a projector is treated very much like a projector but instead of making up slides you now use a TV screen and store your screens in memory to make up a presentation. On loading the program you are asked for information on the type of interface and printer you are intending to use and from a menu you choose the option to match. There is a comprehensive demo program already implanted to show you it's capabilities as well as a 15 page instruction book to help you. After running through the demo you have to clear all the data and start to build up your own presentation. You start at a main menu and select 'New data'. This gives you a range of formats to choose from ie: Years, months, days etc. Following screen prompts you are asked to enter your values, I entered sales on a monthly basis for one year. Once all your data has been entered you have to then give it a a name, say 'sales'. This is then stored and is listed in a directory for use later. Now returning to the main menu you can start to build up your presentation. From the data entered you can choose one of the options to either produce a pie graph, histogram or graph. I started by pressing the graph option which brings you to a sub menu. All you have to do here is choose what calibrations, colour, titles you want by a series of yes (Y) or no(n) answers. You have the option to connect up your points, have a background grid or put in a fit line or curve. Once completed the grid is automatically given a reference number and as it's the first graph it's called G1 .This is also stored in the directory. Building the histogram and pie chart is done in much the same way as the graph and once done these are also given a reference number ie: H1 & P1. With the histogram you can have an overlay, say overlaying last years sales figures with this years. Another feature is the programs ability to forecast or project up to another six places. Now all these graphs etc can be linked with text, this is limited to headings and sub headings but should be adequate for most needs. All the text is written out in enlarged characters so it can be easily read. Each page of text is also given a reference number (K1) and is also stored in the directory. Going back to the main menu you now choose the directory and you can view all the graphs etc listed. Now it's 'fun time' as you now press the 'build/modify-presentation' option from the menu. You then go to a sub menu and choosing 'build' you can put the presentation together. This is done by listing the reference numbers in the sequence you would like them to appear. So, first you would probably start with text, so you enter K1. Then maybe a graph to follow, so enter G1. After the graph perhaps a couple more pages of text, enter K2 & K3 and to follow that a histogram, enter H1 and maybe a pie chart, P1. All the entries can be put into any order you wish and each page can be used several times. Once the presentation is complete you have the option of letting it run automatically or manually to fit in with speech. If you choose the automatic option you can set the speed you want each slide to appear. If done manually you have control via 3 keys to replay the slide that has been shown or to return to the previous slide or to make a hard copy if needed. Once the presentation is running you can also break and stop it which takes you back to the menu. With the presentation complete you are then asked to give it a name and that too is stored in the directory. It's possible to link presentations together to form a larger programme. One of the things this program lacks is the ability to draw graphics. However all is not lost as it does give you the ability to load a pre-defined screen image which could have been drawn on one of the painting programs now available. This could be a logo for your company which will give your presentation a more professional finish. The only gripe I had, was in the graphs. The calibrations that are written on the vertical side are written inside the area which the histogram is printed. This makes them unreadable when the histogram is quite full. Overall I think this is a useful tool to have for any company or training school.
Personal Computer News #87Nov 1984 · p.555/53/55/54/54/5
Features 5/5
Documentation 3/5
Performance 5/5
Overall Value 4/5
Bryan Skinner 4/5
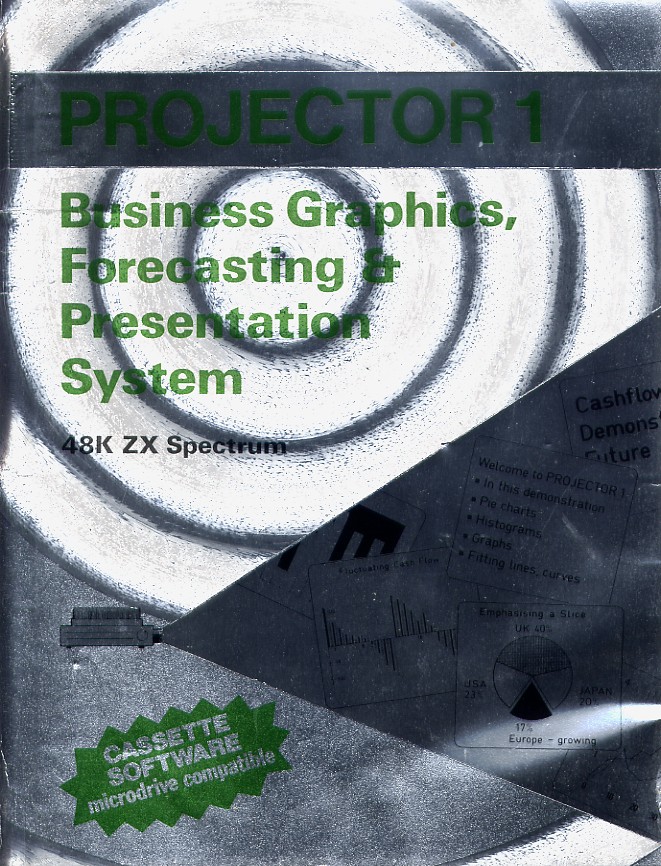
CHART TOPPER Graphic accounts of your finances are possible with this package, says Bryan Skinner. Projector 1 claims to be an advanced business graphics, forecasting and presentation system. Programs aimed at the small business operation are plentiful, but very few of them offer much in the way of graphics. PRESENTATION Projector 1 comes in a large plastic wallet with a 16-page manual inside, which you'll certainly need, even if you are well acquainted with linear regression, standard errors and the like. Pity there's no index, nor even a list of contents - it's a case of start at the beginning, plough your way through and try to remember where that bit about swapping the colour options was. Even so, it's quite well written and even includes 'A word about statistics', which many users will find somewhat impenetrable. The main criticism is that there simply aren't enough examples. It's all fairly obvious if you've had experience of business software, but not for the first-time user who is faced with a screen with no prompts, and little by way of explanation in the manual. FEATURES As all such programs should, Projector 1 includes a demonstration mode to give you some idea of how things can look when everything's going well. And the demo's impressive. There are examples of just about all the program's features, beginning with pie charts and histograms, passing through simple line graphs to linear regression and lines of best fit. The examples use a variety of different labelling techniques. Perhaps the nicest aspect of Projector 1 is that it's not just another 'enter data and print a bar or line graph' package. There are facilities here for making a full public presentation using the Spectrum more or less as you would an overhead projector. You can build up a series of graphs, save them on tape or Microdrive, and link them with screens giving key points in large coloured text. The presentation can be automatic, or you can elect to have it pause after each frame for a key press. And, of course, you can dump any screen or series to the printer. What's more, you can chain existing presentations, but you can't use recursion. The limits are fairly generous. Histograms can have up to 63 bars, enough for about two months' daily data and quite adequate for most uses. For pie charts you're not recommended to exceed ten sectors, because you lose the clarity they can provide. IN USE Naturally, as it's a business graphics package it ought to cope with a wide range of printers. The Spectrum being what it is, this involves matching an even more exotic range of interfacing. Options include Interface 1, Kempston (port or E), Hilderbay, Tasman, ZX printer, and no printer. Other printer driver software can be loaded into high memory, but mustn't be more than 256 bytes, not that you'd know that because it's not on the cover, nor does it tell you in the manual. However, the printer selection system is well programmed, requiring you to confirm a choice before proceeding to load the main program. The main menu has 14 options, each selected by moving the cursor, then pressing Enter. One of my pet hates is when the programmers can't be bothered, or just didn't think to let you run the cursor from first to last or vice versa, without having to plough through all 12 intervening choices. Despite this, the two options you're likely to use most often (New data and Directory) can be selected by single key presses, well, shifted numbers at least. That's another thing - most of the controls are odd. They're quite logical, but at the same time rather awkward. For example, cursor movement in the menu is shifted six and seven, Stop (to quit a section) is symbol shift A. Yes, I know that's the combination for Stop on the keyboard, but some of the other combinations are symbol shift plus another key, you get a bad case of twisted digits after a while. You can have your data drawn up in pie, bar or line form, and there are facilities for linear regression and curve fitting. All this is pretty comprehensive and among the best I've seen in programs of this type. For example, you can choose to have any slices of a pie chart pulled out for emphasis. Axes are scaled automatically, but you can alter this at will. Colour selections extend to background, ink, border, as well as different colours for negative values in the histogram section. The projection facility will prove dear to many a businessperson's heart. Here you can take a set of data (which, by the way, you can enter as quarterly, monthly, yearly, or plain ordinary), and have a line fitted to it to show how that set of data is likely to continue over the next few samples. This can be very handy for picking out trends that may not be apparent from a scattergram with its numerous data points. You can also have a background grid, axes, points joined and so on. The program will calculate the line of best fit, or - quite impressive this - a curve, and will display the equation, together with statistics such as corrected R squared, the standard error of regression, the F value and degrees of freedom. The most impressive facility is the presentation aspect. Data, graphs and key point screens are stored in a directory, which details the types, titles and code numbers. You can select presentation order, automatic or pausing and so on. This means you could use the Spectrum at a meeting to show sales figures, or to impress upon your bank manager why he or she should invest in a project. Because there's a lot of calculation and validation to be done, it's not a fast program. It can take up to 30 seconds to sort out a lot of data, but that's not bad, given the quality of the results. VERDICT Projector 1 covers just about everything you could want. There are some niggles - it asked if I wanted to print out some data after I'd taken the no printer option, for example. The keys are awkward and the manual inadequate, but you could learn to live with this. All in all, it's a flexible and neat package and many will find it an invaluable aid.
Designing a key point slide.
You can pull out a slice of the pie.
Advert5
- Sinclair User #33Dec 1984 · p.170
- ZX Computing #16Dec 1984 · p.155
- Sinclair User #32Nov 1984 · p.80
- Sinclair User #31Oct 1984 · p.48
- ZX Computing #15Oct 1984 · p.88
Review2
- Sinclair Answers #2Jan 1985 · p.95
- Home Computing Weekly #89Nov 1984 · p.10
Offer1
- Sinclair User #35Feb 1985 · p.125
Letters1
- Personal Computer News #95Jan 1985 · p.7
News/Note1
- Home Computing Weekly #87Nov 1984 · p.10
Related
- Tags
- g184
- Same entry at
- Spectrum ComputingZXInfo
Reviews from people here
Sign in to write about this, or make an account. It takes a minute and lets you correct the catalogue too.
No description recorded.
Sign in to correct or add to this.
Hold the rights to this and want it taken down?