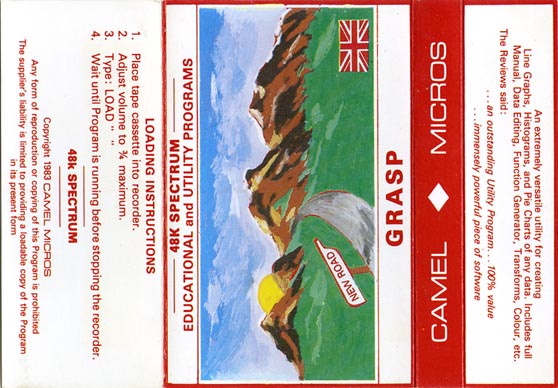
Grasp
Utility: Graphics · ZX-Spectrum 48K · 1 players · English
Camel Micros · 1983 · Pound sterling 6.50
Also known as Cassette 3 (English)
Discussion
Nobody has started a thread about this yet.
Remarks
graph preparation
SPOT: graph plotter
Play
- Grasp.tzx.zipTape image English11 KB
Files and rights
No permission is on record either way. Screens and pictures are copied here on a take-down basis: if you hold the rights and want something removed, say so and it goes.
In the magazines 6
ZX Computing #10Dec 1983 · p.95
Paul Holmes
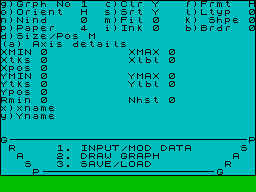
HOLMES INVESTIGATES Paul Holmes inspects a number of new software packages for the ZX Spectrum. GRASP Camel Software I approached this package with a little apprehension - not least because of the rather dubious name (!) since I have had limited experience with business/scientific programs. It turns out to be a graph plotter capable of drawing line graphs, histograms and pie charts. It is also capable of drawing multiple graphs on the same, or different axes, and has the facility to expand and contract graphs, thus allowing inset graphs to be created. With histograms, four different types of shading are allowed, and with line graphs, you can adjust the length of dotted line between points, or you can choose to have a solid line or no line at all. Each set of data is called a 'dataset' (surprise, surprise) and may contain up to 100 items each, and any dataset can be used for either axis. The documentation is generally good, although I found it a little confusing in some places, especially when referring to control characters m the 'Interactive' mode, more of which later. Another part which I found rather unclear was the section on data entry, which seems to have been hastily skipped over (although most of the essential facts are there) and it didn't take long for me to grasp (hmmm...) the principle of operation. The manual is not suitable for the beginner, whether in computing or statistics, but anyone with a small knowledge of both is adequately catered for. A worked example would have been useful, though. Obviously, the best way to evaluate a package of this kind is to try to create some graphs with it. So off I went, test data in hand, to try and create my own graphs. After reading the documentation thoroughly, I loaded the program. I found the menu page somewhat cluttered but soon got used to it. It did take a little while to redraw everytime I made a major change, or when returning after drawing a graph. So, on pressing the '1' key to enter data entry mode, the user is presented with nine options, including facilities to list, add, modify, and delete entries, as well as the rather powerful facility to create datasets using all the functions that the Spectrum can handle, eg sines, cosines, logs, etc. There is also, of course, a straightline-fit facility for y = mx + c, although considering that quite a few scientific calculations will do this for under £25, one might have expected y = mx (for functions that must pass through the origin) as well as fits such as y = ax b or y = logx, since there are found in quite a few relationships in Physics and higher Maths. Then again, whole programs have been written to do only these functions, so perhaps it is asking too much to see them included in such a general piece of software as this. Pressing 'e' to exit from this sub-menu, we were returned to the main menu again. After setting up the many and varied options available to me, eg PAPER, INK and BORDER colours, position and size on screen, solid or dashed line, shape of plot points, number of 'ticks' on each axis; I pressed the '2' key for DRAW. The graph was drawn tolerably quickly, although when the fill option was used (ie fill in the line) on large graphs it could get rather long-winded, and there was no facility for breaking into this routine and getting back to the menu in one piece, which was especially irritating if you noticed that you had mis-chosen one option, since you had to wait for the graph to be drawn before you could go back and change it. After spending about an hour familiarising myself with the package, I found it quite easy to create both graphs and histograms, but although I tried quite hard, for some reason I couldn't even get the shadow of a pie chart, let alone the real thing. Once your diagram has been created, you may go into interactive mode, which allows you to move graphs around (great fun and useful too!), change colours, erase bits, add text and generally play around with your masterpiece until you are satisfied with it. In conclusion a very worthwhile program which I highly recommend to anybody who requires such facilities for home, school, or business.
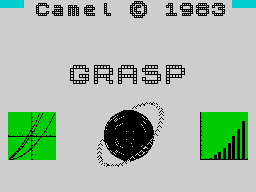
Some example graphical displays obtainable from Camel Software's Grasp.
Advert3
- Popular Computing Weekly #46Nov 1983 · p.54
- Personal Computing Today #1Aug 1983 · p.6
- Personal Computer News #4Apr 1983 · p.32
Letters1
- ZX Computing #12Apr 1984 · p.9
Review1
- Home Computing Weekly #34Oct 1983 · p.29
Reviews from people here
Sign in to write about this, or make an account. It takes a minute and lets you correct the catalogue too.
No credit, tag recorded.
Sign in to correct or add to this.
Hold the rights to this and want it taken down?